Contextual analytics help you analyze the usage, performance, and traffic of your Dev Portal.
Contextual developer application analytics
Developers can view analytics for authenticated traffic from their registered applications within the Konnect Dev Portal. These metrics help developers monitor usage patterns and understand how different APIs are being consumed.
Each application has its own dashboard, which provides a high-level summary of the Number of Requests, Average Error Rate, and Latency, and charts for the following data points:
- Requests by API
- Latency by API
- Error code distribution
All of these metrics can be viewed within a selected time frame of up to 90 days and are available exclusively to customers with Konnect Observability.
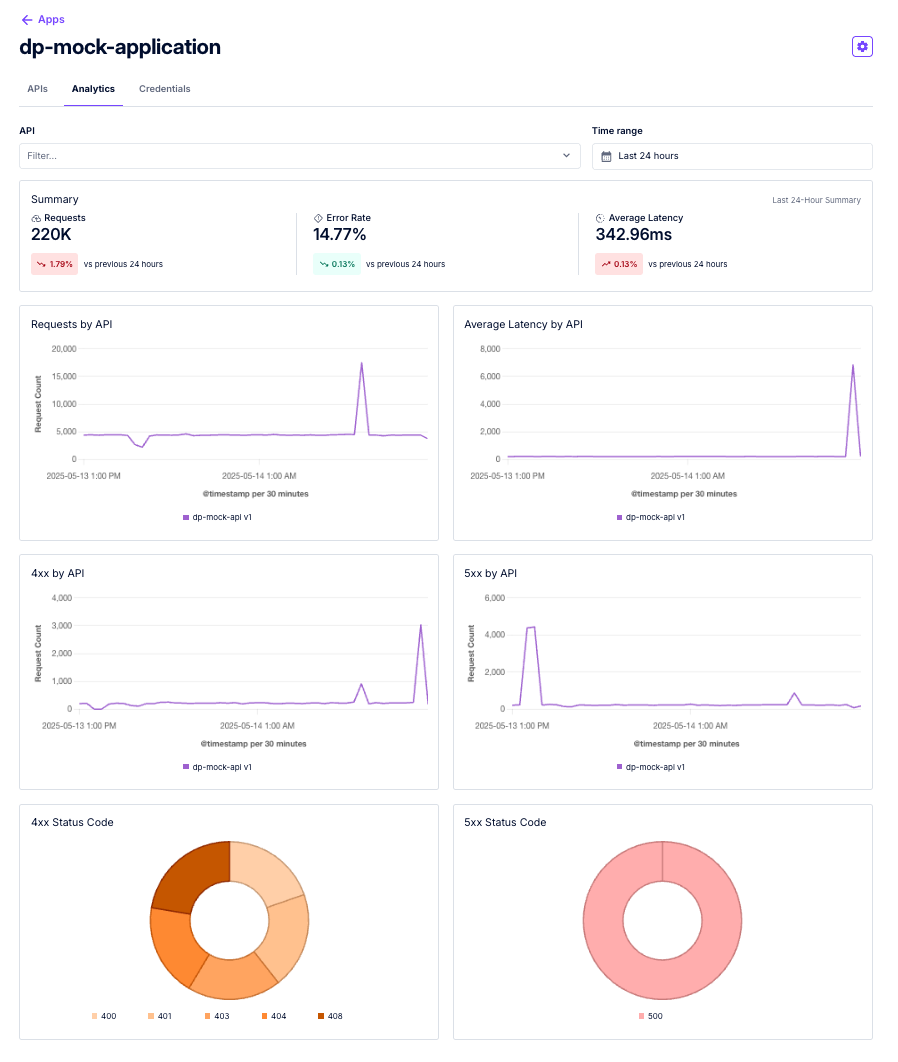
Figure 1: An example dashboard for an application
Konnect contextual Dev Portal analytics
The Konnect platform provides built-in contextual analytics across the Dev Portal section, offering insights into Dev Portals, APIs, and applications. These platform-wide metrics help administrators monitor overall usage, performance, and traffic trends.
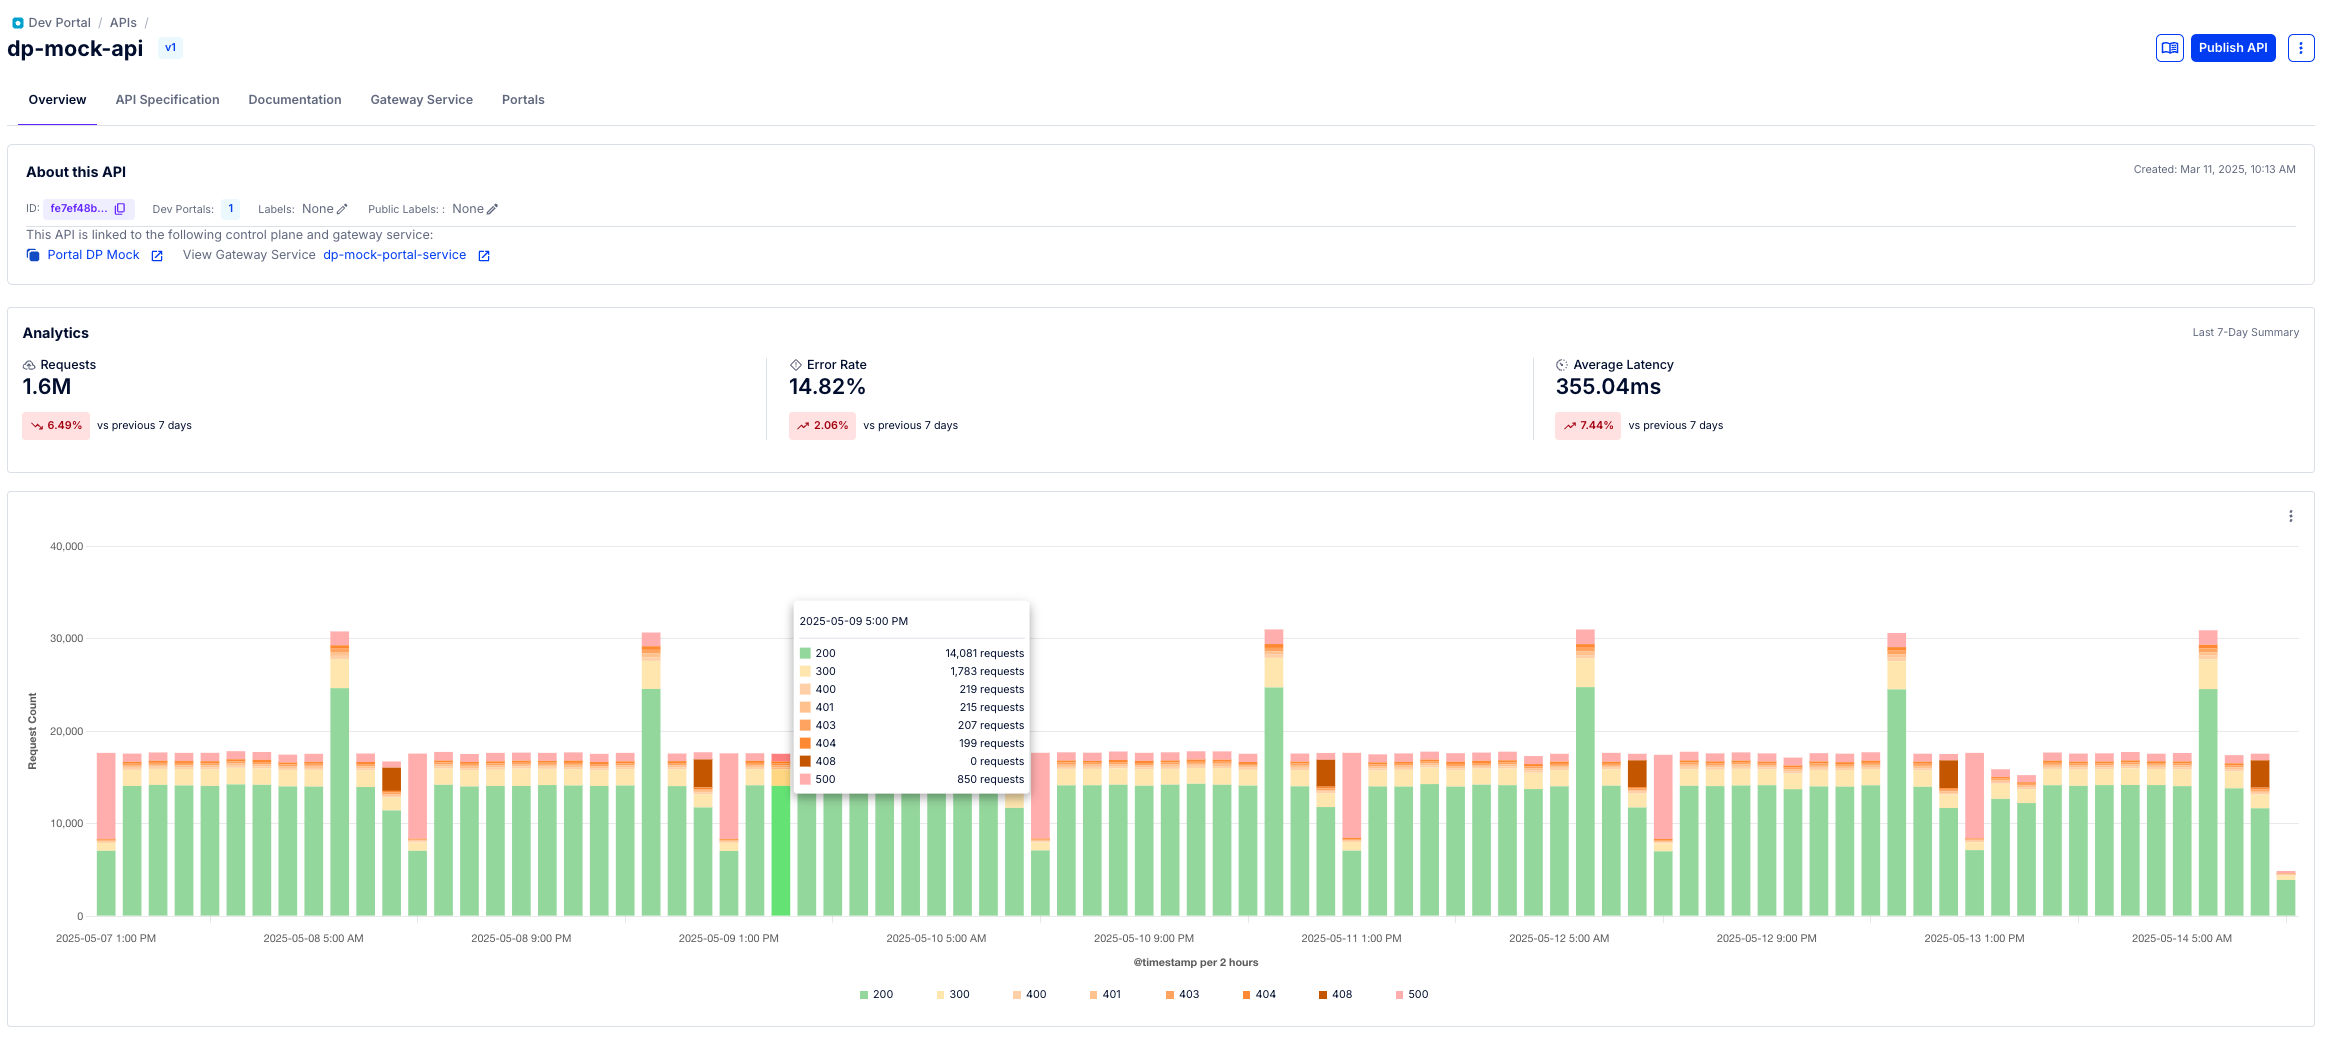
Figure 2: An example of Konnect contextual analytics for an API version
- In addition to these high-level insights, administrators can explore the Konnect Analytics section to create custom reports, build dashboards, and view detailed request data for a more comprehensive and flexible understanding of portal activity.
- Portal and API contextual analytics are available to all customers. Access to Konnect Analytics and application contextual analytics insights requires Observability.