The following spans are available.
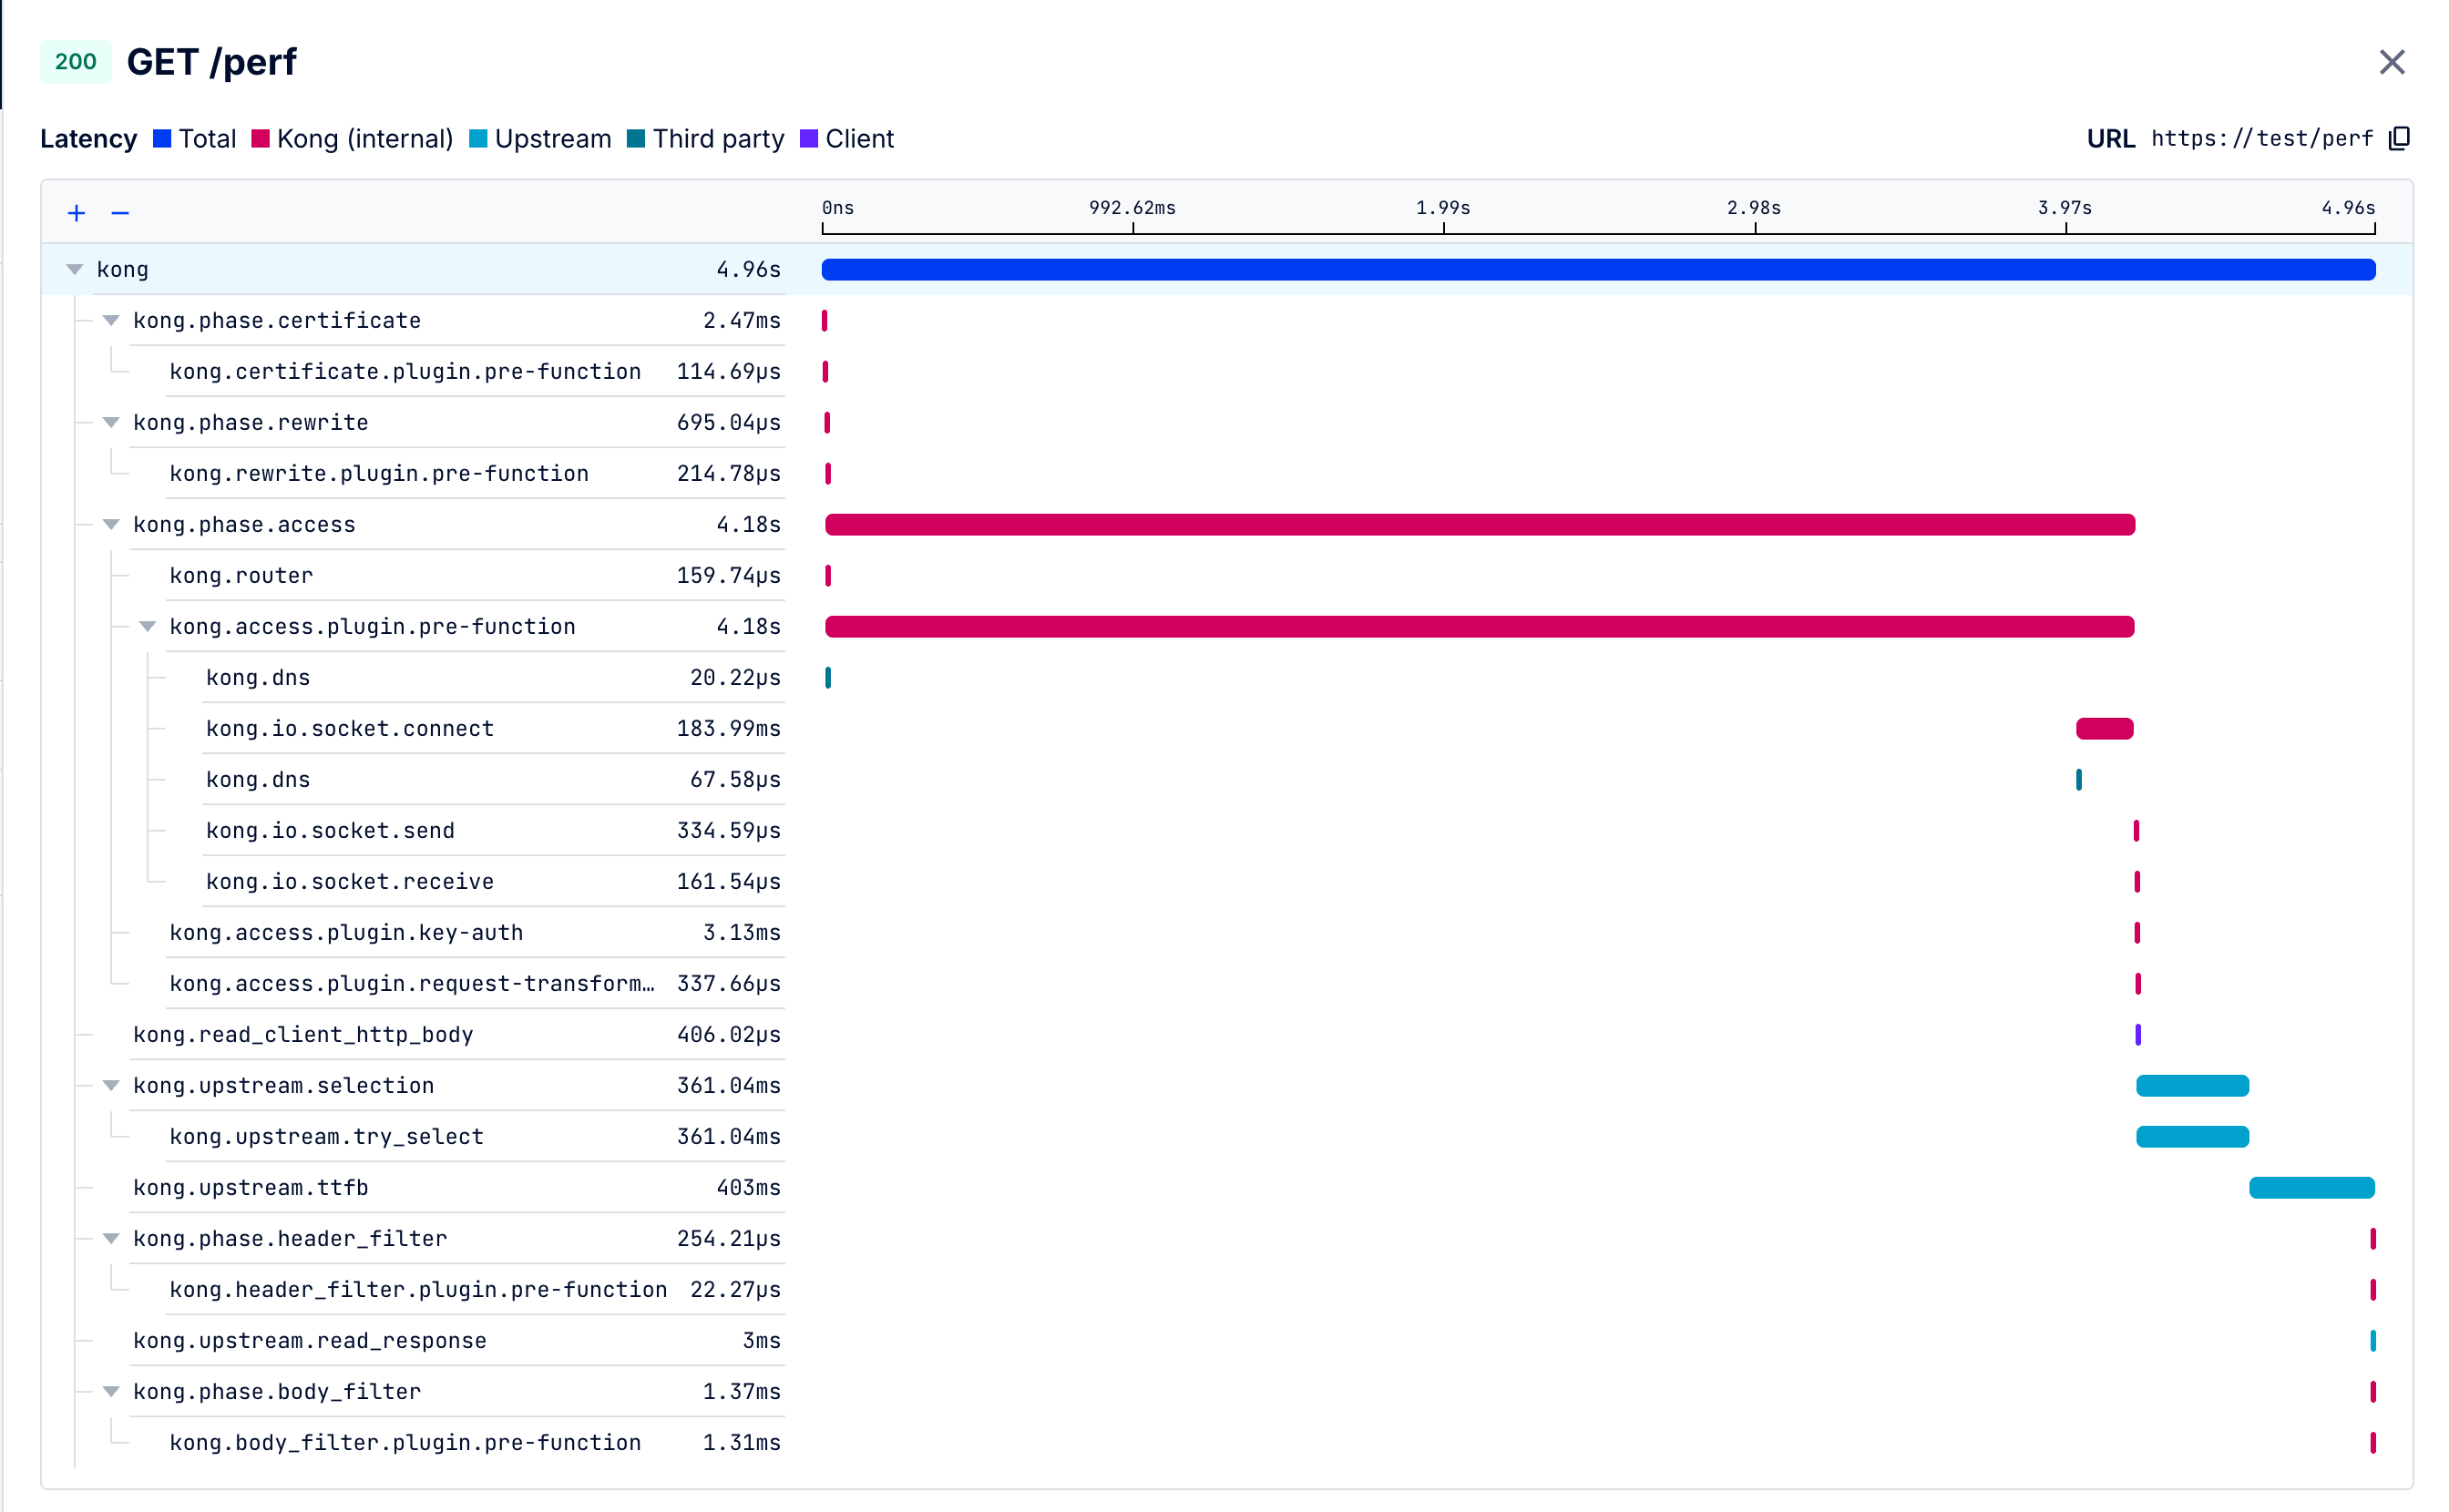
The root span.
This span has the following attributes:
|
Name
|
Description
|
url.full
|
Full url, without query parameters
|
client.address
|
Remote address of the client making the request. This considers forwarded addresses in cases when a load balancer is in front of Kong. Note: this requires configuring the real_ip_header and trusted_ips global configuration options.
|
client.port
|
Remote port of the client making the request. This considers forwarded ports in cases when a load balancer is in front of Kong. Note: this requires configuring the real_ip_header and trusted_ips global configuration options.
|
network.peer.address
|
IP of the component that is connecting to Kong
|
network.peer.port
|
Port of the component that is connecting to Kong
|
server.address
|
Kong’s DNS name or IP used in client connection
|
server.port
|
Kong’s public port
|
network.protocol.name
|
HTTP, gRPC, WS, Kafka, etc.
|
http.request.method
|
HTTP request method
|
http.request.body.size
|
Request content length or equivalent in bytes
|
http.request.size
|
Request body size and request headers size in bytes
|
http.response.body.size
|
Response content length or equivalent in bytes
|
http.response.size
|
Response body size and response headers size in bytes
|
proxy.kong.request.id
|
Unique ID for each request
|
proxy.kong.request.time
|
Request time as measured by Nginx ($request_time)
|
url.scheme
|
Protocol identifier
|
network.protocol.version
|
Version of the HTTP protocol used in establishing connection [1.2, 2.0]
|
tls.client.server_name
|
SNI
|
http.request.header.host
|
Host header if present. This can be different from the SNI.
|
proxy.kong.consumer_id
|
Authenticated Consumer ID if present
|
proxy.kong.upstream_id
|
Resolved Upstream ID
|
proxy.kong.upstream_status_code
|
status code returned by upstream
|
http.response.status_code
|
Status code sent back by Kong
|
proxy.kong.latency.upstream
|
Time between the connection to the upstream and the last byte of response
|
proxy.kong.latency.total
|
Time between the first byte into Kong and the last byte out of Kong
|
proxy.kong.latency.internal
|
Time taken by Kong to process the request. Excludes client and upstream read/write times, and i/o times.
|
proxy.kong.latency.net_io_timings
|
Array containing ip, connect_time, and rw_time. I/o outside of the request context is not considered.
|
proxy.kong.client_KA
|
Whether the downstream used a KeepAlive connection
|
tls.resumed
|
Whether the TLS session reused
|
tls.client.subject
|
x509 client DN (if mTLS)
|
tls.server.subject
|
x509 DN for cert Kong presented
|
tls.cipher
|
Negotiated cipher
|
A span capturing the execution of the certificate phase of request processing. Any plugins configured for running in this phase will show up as individual child spans.
A span capturing the execution of a plugin configured to run in the certificate phase. Multiple such spans can occur in a trace.
This span has the following attributes:
|
Name
|
Description
|
proxy.kong.plugin.instance_id
|
Instance ID of the plugin configuration that ran
|
A span that captures the execution of the TLS handshake between the client and Kong.
This span includes any I/O operations involved in the handshake, which may be prolonged due to slow client behavior.
A span capturing the time taken to read HTTP headers from the client.
This span is useful for detecting clients that are coming over a slow network or a buggy CDN, or simply take too long to send in the HTTP headers.
This span has the following attributes:
|
Name
|
Description
|
proxy.kong.http_headers_count
|
Number of headers sent by the client
|
proxy.kong.http_headers_size
|
Size (in bytes) of headers sent by the client
|
A span capturing the total time taken to read the full body sent by the client. This span can identify slow clients, a buggy CDN and very large body submissions.
A span capturing the execution of the rewrite phase of request processing. Any plugins configured for running in this phase will show up as individual child spans.
A span capturing the execution of a plugin configured to run in the rewrite phase. Multiple such spans can occur in a trace.
This span has the following attributes:
|
Name
|
Description
|
proxy.kong.plugin.instance_id
|
Instance ID of the plugin configuration that ran
|
A span capturing network i/o timing that occurs during plugin execution or other request processing.
Can be one of:
-
kong.io.http.request: Requests done by the internal http client during the flow
-
kong.io.http.connect: Connections done by the internal http client during the flow
-
kong.io.redis.function: Redis functions
-
kong.io.socket.function: Functions called on the internal nginx socket
Examples:
- OIDC plugin making calls to IdP
- Rate Limiting Advanced plugin making calls to Redis
- Custom plugins calling HTTP URLs
Multiple instances of this span can occur anywhere in the trace when i/o happens.
This span has the following attributes:
|
Name
|
Description
|
network.peer.address
|
Address of the peer Kong connected with
|
network.protocol.name
|
Protocol that was used (Redis, TCP, HTTP, gRPC, etc.)
|
A span capturing the execution of the Kong router.
This span has the following attributes:
|
Name
|
Description
|
proxy.kong.router.matched
|
Whether the router find a match for the request
|
proxy.kong.router.route_id
|
ID of the Route that was matched
|
proxy.kong.router.service_id
|
ID of the Service that was matched
|
proxy.kong.router.upstream_path
|
Path of the upstream url returned by the match
|
proxy.kong.router.cache_hit
|
Whether the match returned from cache
|
A span capturing the execution of the access phase of request processing.
Any plugins configured for running in this phase will show up as individual child spans.
A span capturing the execution of a plugin configured to run in the access phase. Multiple such spans can occur in a trace.
This span has the following attributes:
|
Name
|
Description
|
proxy.kong.plugin.instance_id
|
Instance ID of the plugin configuration that ran
|
A span capturing the time spent in looking up DNS.
This span has the following attributes:
|
Name
|
Description
|
proxy.kong.dns.entry
|
A list of DNS attempts, responses and errors if any
|
A span capturing the total time spent in finding a healthy upstream.
Depending on configuration, Kong will try to find a healthy upstream by trying various targets in order determined by the load balancing algorithm.
Child spans of this span capture the individual attempts.
This span has the following attributes:
|
Name
|
Description
|
proxy.kong.upstream.lb_algorithm
|
the load balancing algorithm used for finding the upstream
|
A span capturing the attempt to verify a specific upstream.
Kong attempts to open a TCP connection (if not KeepAlive cache is found), do a TLS handshake, and send down the HTTP headers.
If all of this succeeds, the upstream is healthy and Kong will finish sending the full request and wait for a response.
If any of the steps fail, Kong will switch to the next target and try again.
The last of these spans (or the only one, if the first attempt succeeds) ends as soon as the connection is established,
ensuring that the total time captured by the parent kong.upstream.selection span always reflects only the time
spent connecting to the selected upstream.
Depending on how the proxy_next_upstream directive is configured, earlier (failed) tries may involve additional I/O.
For example, if retries are triggered based on the upstream’s status code or header validity, those attempts will include sending the request and reading the response status line and headers which is enough for Kong to determine whether to retry.
This span has the following attributes:
|
Name
|
Description
|
network.peer.address
|
the IP address of the target upstream
|
network.peer.name
|
the DNS name of the target upstream
|
network.peer.port
|
the port number of the target
|
try_count
|
The number of attempts Kong has made to find a healthy upstream
|
keepalive
|
Is this a KeepAlive connection?
|
A span capturing the time taken to write the http request (headers and body) to upstream.
This span can be used to identify network delays between Kong and an upstream.
A span capturing the time taken for the upstream to generate the response headers.
This span can be used to identify slowness in response generation from upstreams.
If there is a delay after the request is sent but before the upstream starts responding, that time to first byte is also included in this span.
A span capturing the time taken for the upstream to generate the response body.
This span can be used to identify slowness in response generation from upstreams.
A span capturing the execution of the response phase.
Any plugins configured for running in this phase will show up as individual child spans. This phase will not run if response streaming is enabled.
A span capturing the execution of a plugin configured to run in the response phase. Multiple such spans can occur in a trace.
This span has the following attributes:
|
Name
|
Description
|
proxy.kong.plugin.instance_id
|
Instance ID of the plugin configuration that ran
|
A span capturing the execution of the header filter phase of response processing. Any plugins configured for running in this phase will show up as individual child spans.
A span capturing the execution of a plugin configured to run in the header_filter phase. Multiple such spans can occur in a trace.
This span has the following attributes:
|
Name
|
Description
|
proxy.kong.plugin.instance_id
|
Instance ID of the plugin configuration that ran
|
A span capturing the execution of the body filter phase of response processing. Any plugins configured for running in this phase will show up as individual child spans.
A span capturing the execution of a plugin configured to run in the body_filter phase. Multiple such spans can occur in a trace.
This span has the following attributes:
|
Name
|
Description
|
proxy.kong.plugin.instance_id
|
Instance ID of the plugin configuration that ran
|
A span that measures the time Kong spends finishing the response write to the client.
This duration may be extended for slow-reading clients, resulting in a longer span.