Grafana can show the following metrics that are scraped from Prometheus.
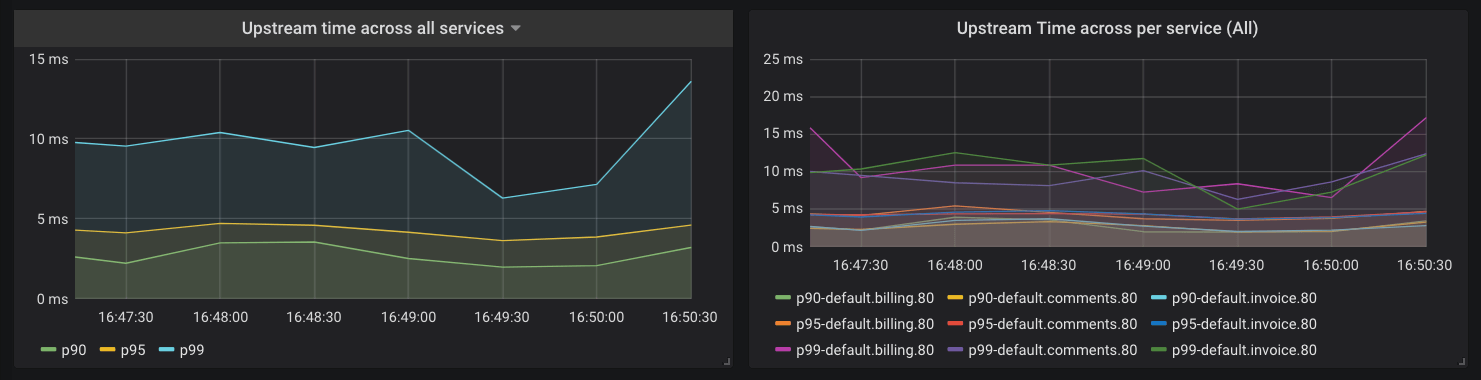
Kong Gateway collects the latency data of how long your Services take to respond to requests. You can use this data to alert the on-call engineer if the latency goes beyond a certain threshold. For example, let’s say you have an SLA that your APIs will respond with latency of less than 20 millisecond for 95% of requests. You could configure Prometheus to alert you based on the following query:
histogram_quantile(0.95, sum(rate(kong_request_latency_ms_sum{route=~"$route"}[1m])) by (le)) > 20
This query calculates the 95th percentile of the total request latency (or duration) for all of your Services and alerts you if it is more than 20 milliseconds. The “type” label in this query is “request”, which tracks the latency added by Kong Gateway and the Service. You can switch this to “upstream” to track latency added by only the Service. Prometheus is highly flexible and well-documented, so we won’t go into the details of setting up alerts here, but you’ll be able to find them in the Prometheus documentation.
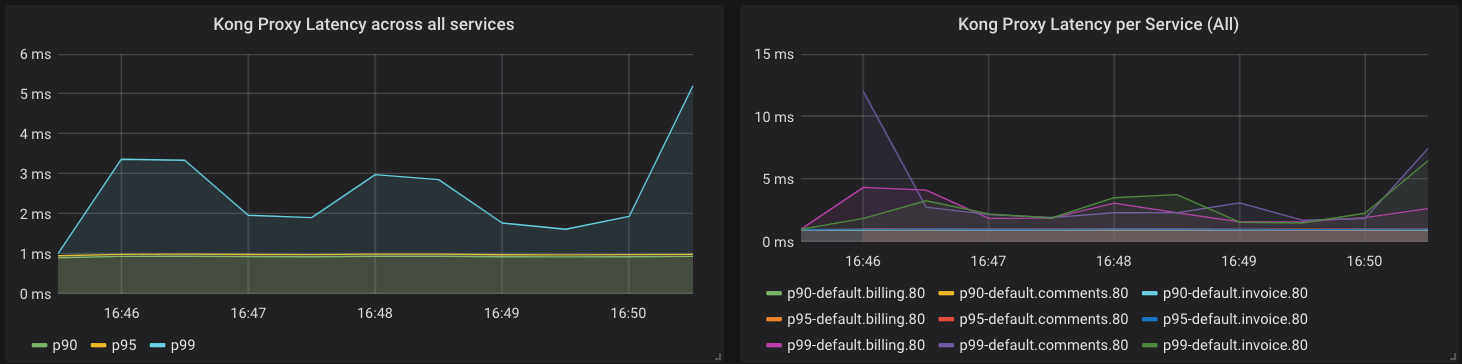
Kong Gateway also collects metrics about its performance. The following query is similar to the previous one, but gives us insight into latency added by Kong Gateway:
histogram_quantile(0.90, sum(rate(kong_kong_latency_ms_bucket[1m])) by (le,service)) > 2
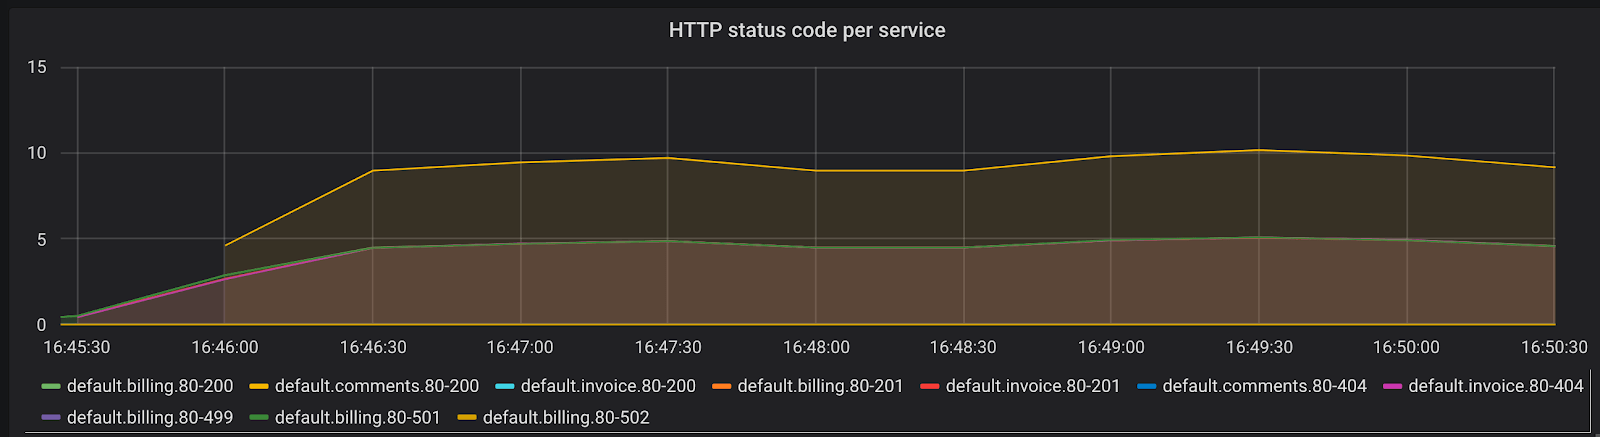
Another important metric to track is the rate of errors and requests your Services are serving. The time series kong_http_status collects HTTP status code metrics for each Service.
This metric can help you track the rate of errors for each of your Services:
sum(rate(kong_http_requests_total{code=~"5[0-9]{2}"}[1m])) by (service)
You can also calculate the percentage of requests in any duration that are errors. Try to come up with a query to derive that result.
All HTTP status codes are indexed, meaning you could use the data to learn about your typical traffic pattern and identify problems. For example, a sudden rise in 404 response codes could be indicative of client codes requesting an endpoint that was removed in a recent deploy.
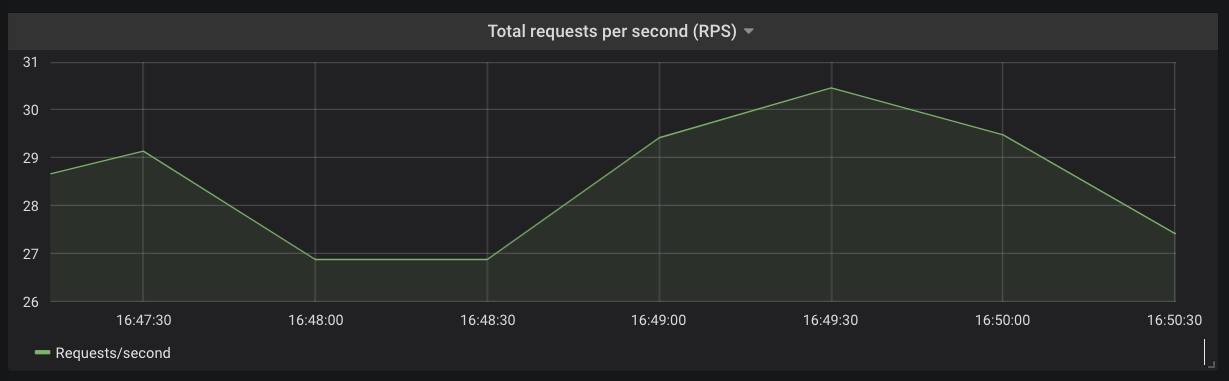
You can derive the total request rate for each of your Services or across your Kubernetes cluster using the kong_http_status time series.
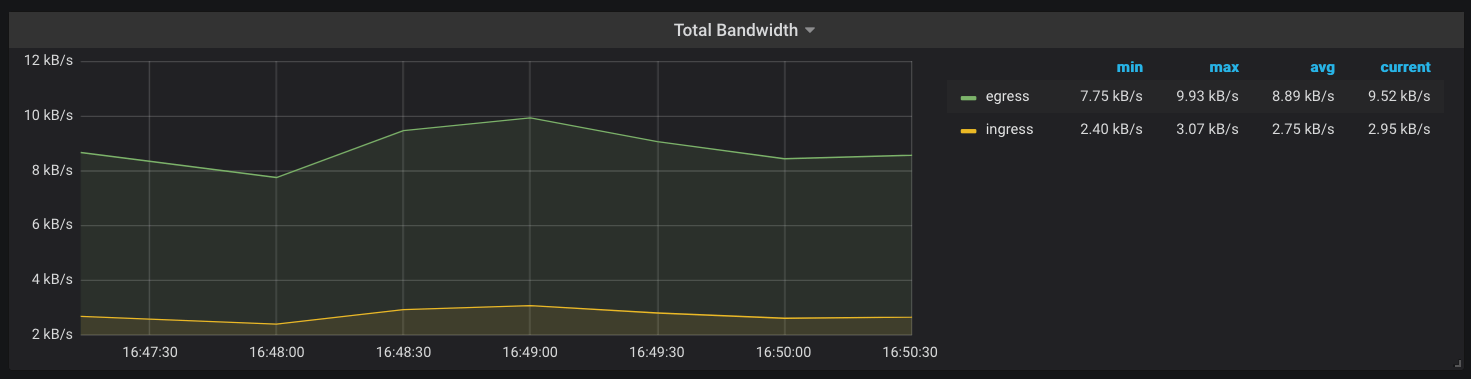
Another metric that Kong Gateway keeps track of is the amount of network bandwidth (kong_bandwidth) being consumed. This gives you an estimate of how request/response sizes correlate with other behaviors in your infrastructure.
You now have metrics for the Services running inside your Kubernetes cluster and have much more visibility into your applications, without making any modifications in your Services. You can use Alertmanager or Grafana to now configure alerts based on
the metrics observed and your SLOs.