CONTROL_PLANE_DETAILS=$(curl -X POST "https://us.api.konghq.com/v2/control-planes" \
--no-progress-meter --fail-with-body \
-H "Authorization: Bearer $KONNECT_TOKEN" \
--json '{
"name": "My KIC CP",
"cluster_type": "CLUSTER_TYPE_K8S_INGRESS_CONTROLLER"
}'
)Monitor metrics with Prometheus and Grafana
Uses:
Kong Ingress Controller
Deployment Platform
Related Documentation
TL;DR
Deploy a servicemonitor Kubernetes resource using the Kong Gateway Helm chart, then use a KongClusterPlugin to configure the prometheus plugin for all Services in the cluster.
Prerequisites
Kong Konnect
If you don’t have a Konnect account, you can get started quickly with our onboarding wizard.
- The following Konnect items are required to complete this tutorial:
- Personal access token (PAT): Create a new personal access token by opening the Konnect PAT page and selecting Generate Token.
-
Set the personal access token as an environment variable:
export KONNECT_TOKEN='YOUR KONNECT TOKEN'
Enable the Gateway API
-
Install the Gateway API CRDs before installing Kong Ingress Controller.
kubectl apply -f https://github.com/kubernetes-sigs/gateway-api/releases/download/v1.5.1/standard-install.yaml -
Create a
GatewayandGatewayClassinstance to use.echo " apiVersion: v1 kind: Namespace metadata: name: kong --- apiVersion: gateway.networking.k8s.io/v1 kind: GatewayClass metadata: name: kong annotations: konghq.com/gatewayclass-unmanaged: 'true' spec: controllerName: konghq.com/kic-gateway-controller --- apiVersion: gateway.networking.k8s.io/v1 kind: Gateway metadata: name: kong spec: gatewayClassName: kong listeners: - name: proxy port: 80 protocol: HTTP allowedRoutes: namespaces: from: All " | kubectl apply -n kong -f -
Install Prometheus
Create a values-monitoring.yaml file to set the scrape interval, use Grafana persistence, and install Kong Gateway’s dashboard:
prometheus:
  prometheusSpec:
    scrapeInterval: 10s
    evaluationInterval: 30s
grafana:
  persistence:
    enabled: true  # enable persistence using Persistent Volumes
  dashboardProviders:
    dashboardproviders.yaml:
      apiVersion: 1
      providers:
      - name: 'default' # Configure a dashboard provider file to
        orgId: 1        # put Kong dashboard into.
        folder: ''
        type: file
        disableDeletion: false
        editable: true
        options:
          path: /var/lib/grafana/dashboards/default
  dashboards:
    default:
      kong-dash:
        gnetId: 7424  # Install the following Grafana dashboard in the
        revision: 11  # instance: https://grafana.com/dashboards/7424
        datasource: Prometheus
      kic-dash:
        gnetId: 15662
datasource: PrometheusTo install Prometheus and Grafana, execute the following, specifying the path to the values-monitoring.yaml file that you created:
kubectl create namespace monitoring
helm repo add prometheus-community https://prometheus-community.github.io/helm-charts
helm install promstack prometheus-community/kube-prometheus-stack --namespace monitoring --version 52.1.0 -f values-monitoring.yamlBy default, kube-prometheus-stack selects ServiceMonitors and PodMonitors by a release label equal to the release name. We will set the release label when we install Kong Ingress Controller.
Create a KIC Control Plane
Use the Konnect API to create a new CLUSTER_TYPE_K8S_INGRESS_CONTROLLER Control Plane:
We’ll need the id and telemetry_endpoint for the values.yaml file later. Save them as environment variables:
CONTROL_PLANE_ID=$(echo $CONTROL_PLANE_DETAILS | jq -r .id)
CONTROL_PLANE_TELEMETRY=$(echo $CONTROL_PLANE_DETAILS | jq -r '.config.telemetry_endpoint | sub("https://";"")')Create mTLS certificates
Kong Ingress Controller talks to Konnect over a connected secured with TLS certificates.
Generate a new certificate using openssl:
openssl req -new -x509 -nodes -newkey rsa:2048 -subj "/CN=kongdp/C=US" -keyout ./tls.key -out ./tls.crtThe certificate needs to be a single line string to send it to the Konnect API with curl. Use awk to format the certificate:
export CERT=$(awk 'NF {sub(/\r/, ""); printf "%s\\n",$0;}' tls.crt);Next, upload the certificate to Konnect:
curl -X POST "https://us.api.konghq.com/v2/control-planes/$CONTROL_PLANE_ID/dp-client-certificates" \
     --no-progress-meter --fail-with-body  \
     -H "Authorization: Bearer $KONNECT_TOKEN" \
     --json '{
       "cert": "'$CERT'"
}'Finally, store the certificate in a Kubernetes secret so that Kong Ingress Controller can read it:
kubectl create namespace kong -o yaml --dry-run=client | kubectl apply -f -
kubectl create secret tls konnect-client-tls -n kong --cert=./tls.crt --key=./tls.keyKong Ingress Controller running (attached to Konnect)
-
Add the Kong Helm charts:
helm repo add kong https://charts.konghq.com helm repo update -
Create a
values.yamlfile:cat <<EOF > values.yaml controller: ingressController: image: tag: "3.5" env: feature_gates: "FillIDs=true" konnect: license: enabled: true enabled: true controlPlaneID: "$CONTROL_PLANE_ID" tlsClientCertSecretName: konnect-client-tls apiHostname: "us.kic.api.konghq.com" gateway: image: repository: kong tag: "3.9.3" env: konnect_mode: 'on' vitals: "off" cluster_mtls: pki cluster_telemetry_endpoint: "$CONTROL_PLANE_TELEMETRY:443" cluster_telemetry_server_name: "$CONTROL_PLANE_TELEMETRY" cluster_cert: /etc/secrets/konnect-client-tls/tls.crt cluster_cert_key: /etc/secrets/konnect-client-tls/tls.key lua_ssl_trusted_certificate: system proxy_access_log: "off" dns_stale_ttl: "3600" secretVolumes: - konnect-client-tls EOF -
Install Kong Ingress Controller using Helm:
helm install kong kong/ingress -n kong --create-namespace --set gateway.serviceMonitor.enabled=true --set gateway.serviceMonitor.labels.release=promstack --values ./values.yaml --wait -
Set
$PROXY_IPas an environment variable for future commands:export PROXY_IP=$(kubectl get svc --namespace kong kong-gateway-proxy -o jsonpath='{range .status.loadBalancer.ingress[0]}{@.ip}{@.hostname}{end}') echo $PROXY_IP
Kong Ingress Controller running
-
Add the Kong Helm charts:
helm repo add kong https://charts.konghq.com helm repo update -
Install Kong Ingress Controller using Helm:
helm install kong kong/ingress -n kong --create-namespace --set gateway.serviceMonitor.enabled=true --set gateway.serviceMonitor.labels.release=promstack --wait -
Set
$PROXY_IPas an environment variable for future commands:export PROXY_IP=$(kubectl get svc --namespace kong kong-gateway-proxy -o jsonpath='{range .status.loadBalancer.ingress[0]}{@.ip}{@.hostname}{end}') echo $PROXY_IP
How it works
Kong Gateway provides a Prometheus plugin that exports Gateway Service and Route metrics automatically.
The Prometheus stack scrapes metrics from deployments that match the labels defined within a servicemonitor resource. The Kong Ingress Controller Helm chart can automatically label your deployments and create a servicemonitor instance to enable Prometheus metrics scraping.
Enable Prometheus
Kong Gateway doesn’t expose Prometheus metrics by default. To enable the metrics, create a prometheus plugin instance:
echo "
apiVersion: configuration.konghq.com/v1
kind: KongClusterPlugin
metadata:
  name: prometheus
  namespace: kong
  annotations:
    kubernetes.io/ingress.class: kong
  labels:
    global: 'true'
config:
  status_code_metrics: true
  bandwidth_metrics: true
  upstream_health_metrics: true
  latency_metrics: true
  per_consumer: false
plugin: prometheus
" | kubectl apply -f -Deploy demo Services
This how-to deploys multiple Services to your Kubernetes cluster to simulate a production environment.
Deploy the Services and create routing resources:
kubectl apply -f https://developer.konghq.com/manifests/kic/multiple-services.yaml -n kongGenerate traffic
Once the Service and Routes are deployed, it’s time to generate some fake traffic. In the same terminal window, run the following command:
while true;
do
  curl $PROXY_IP/billing/status/200
  curl $PROXY_IP/billing/status/501
  curl $PROXY_IP/invoice/status/201
  curl $PROXY_IP/invoice/status/404
  curl $PROXY_IP/comments/status/200
  curl $PROXY_IP/comments/status/200
  sleep 0.01
doneAccess Grafana
Grafana is an observability tool that you can use to observe Prometheus metrics over time. To access Grafana, you will need to port-forward the Services in a new terminal window:
kubectl -n monitoring port-forward services/prometheus-operated 9090 &
kubectl -n monitoring port-forward services/promstack-grafana 3000:80 &You will also need to get the password for the admin user.
Execute the following to see and copy the password:
kubectl get secret --namespace monitoring promstack-grafana -o jsonpath="{.data.admin-password}" | base64 --decode ; echoNavigate to http://localhost:3000 and use the username admin and the password that you copied.
Once logged in, you will see a Kong (official) dashboard in the bottom left. Click on this link.
Metrics collected
Grafana can show the following metrics that are scraped from Prometheus.
Request latencies of various Services
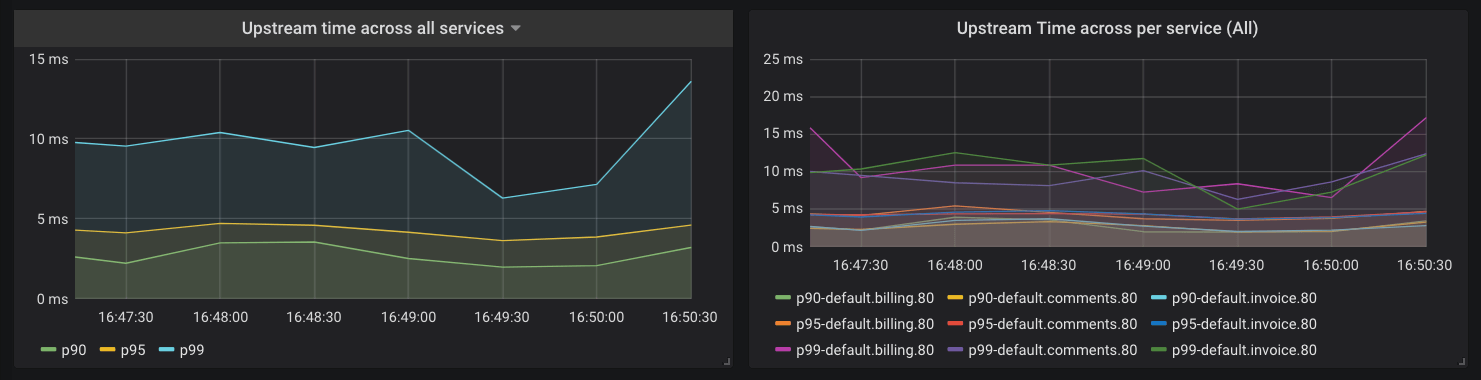
Kong Gateway collects the latency data of how long your Services take to respond to requests. You can use this data to alert the on-call engineer if the latency goes beyond a certain threshold. For example, let’s say you have an SLA that your APIs will respond with latency of less than 20 millisecond for 95% of requests. You could configure Prometheus to alert you based on the following query:
histogram_quantile(0.95, sum(rate(kong_request_latency_ms_sum{route=~"$route"}[1m])) by (le)) > 20This query calculates the 95th percentile of the total request latency (or duration) for all of your Services and alerts you if it is more than 20 milliseconds. The “type” label in this query is “request”, which tracks the latency added by Kong Gateway and the Service. You can switch this to “upstream” to track latency added by only the Service. Prometheus is highly flexible and well-documented, so we won’t go into the details of setting up alerts here, but you’ll be able to find them in the Prometheus documentation.
Kong Gateway proxy latency
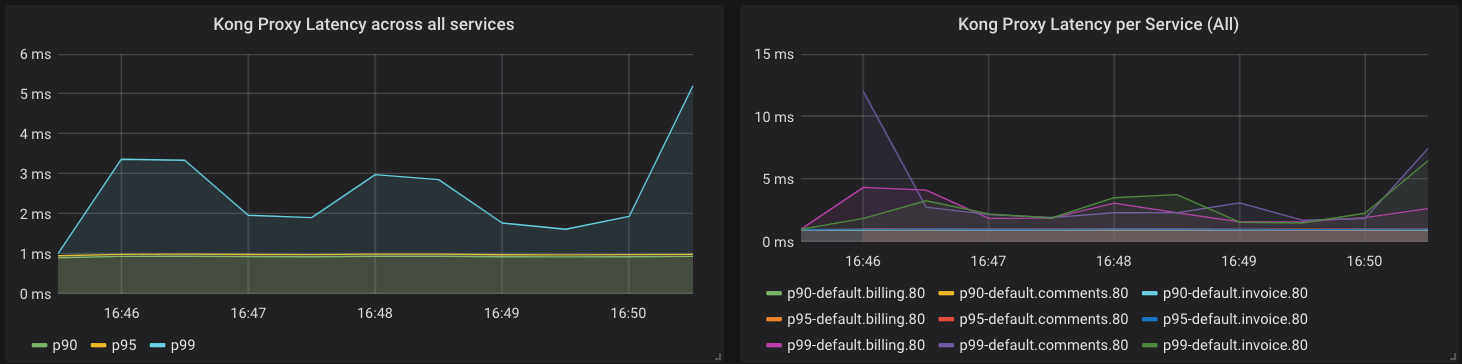
Kong Gateway also collects metrics about its performance. The following query is similar to the previous one, but gives us insight into latency added by Kong Gateway:
histogram_quantile(0.90, sum(rate(kong_kong_latency_ms_bucket[1m])) by (le,service)) > 2Error rates
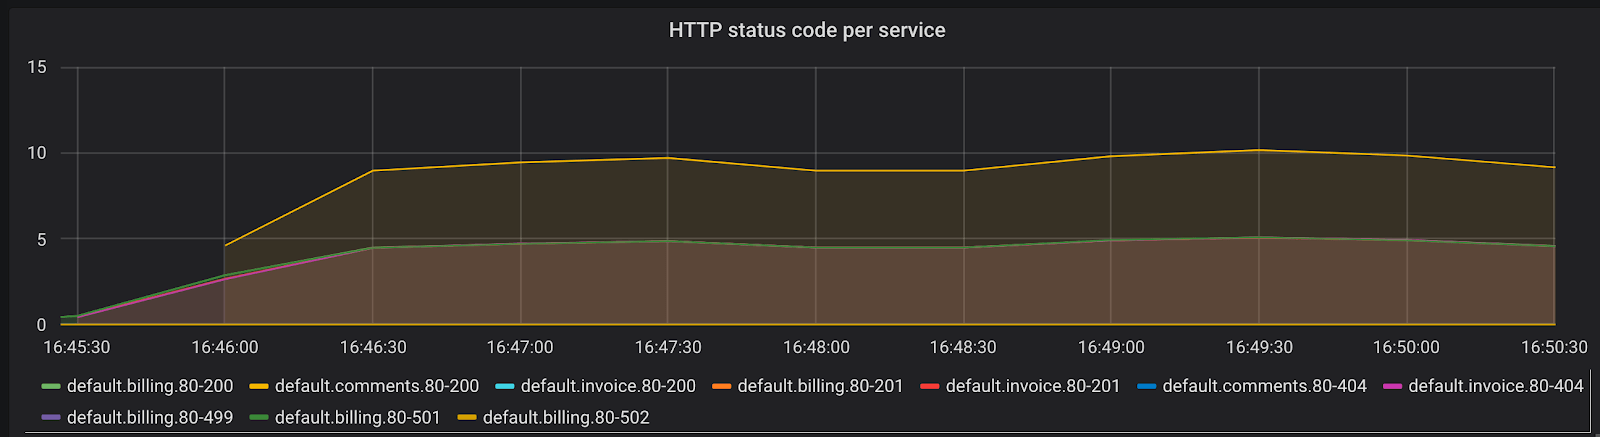
Another important metric to track is the rate of errors and requests your Services are serving. The time series kong_http_status collects HTTP status code metrics for each Service.
This metric can help you track the rate of errors for each of your Services:
sum(rate(kong_http_requests_total{code=~"5[0-9]{2}"}[1m])) by (service)You can also calculate the percentage of requests in any duration that are errors. Try to come up with a query to derive that result.
All HTTP status codes are indexed, meaning you could use the data to learn about your typical traffic pattern and identify problems. For example, a sudden rise in 404 response codes could be indicative of client codes requesting an endpoint that was removed in a recent deploy.
Request rate and bandwidth
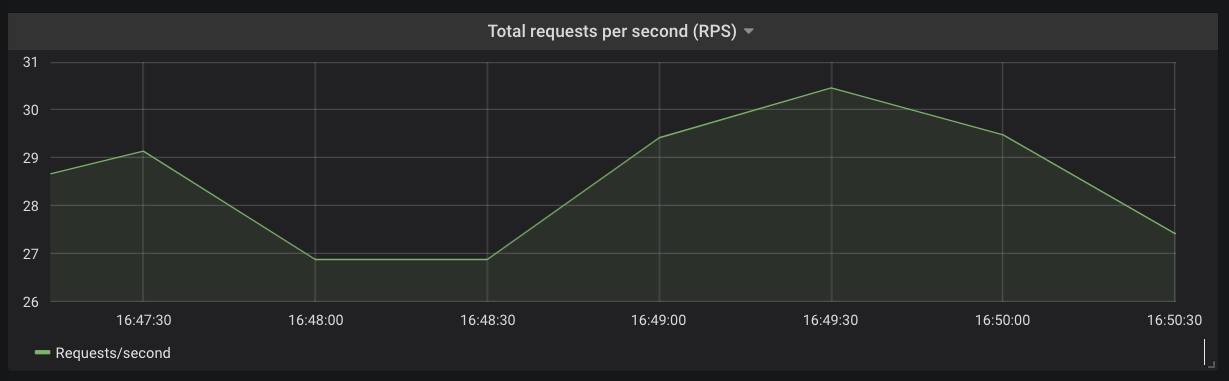
You can derive the total request rate for each of your Services or across your Kubernetes cluster using the kong_http_status time series.
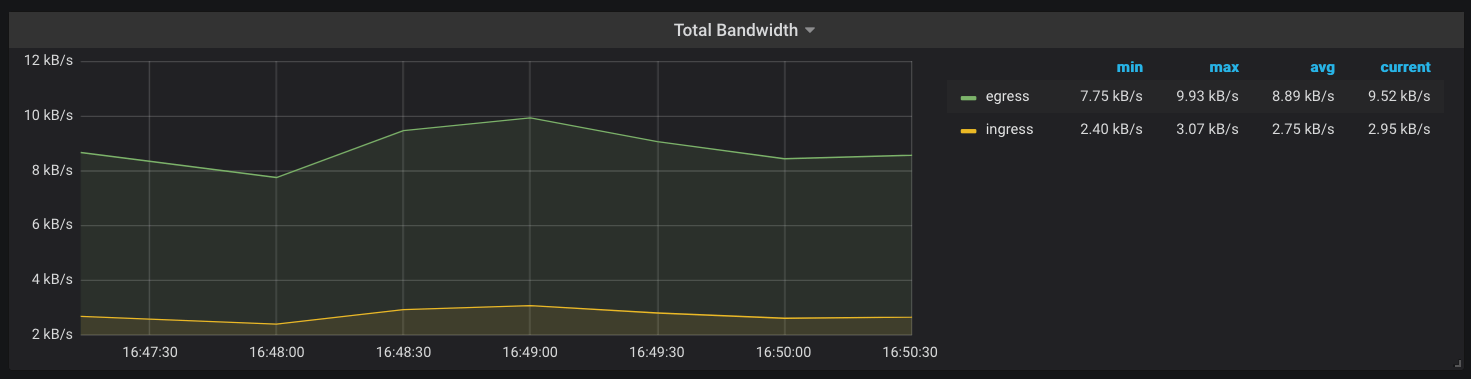
Another metric that Kong Gateway keeps track of is the amount of network bandwidth (kong_bandwidth) being consumed. This gives you an estimate of how request/response sizes correlate with other behaviors in your infrastructure.
You now have metrics for the Services running inside your Kubernetes cluster and have much more visibility into your applications, without making any modifications in your Services. You can use Alertmanager or Grafana to now configure alerts based on the metrics observed and your SLOs.
Cleanup
Uninstall KIC from your cluster
helm uninstall kong -n kongFAQs
If I have multiple Data Plane nodes with the Prometheus plugin enabled, does the metrics data reflect the status of a single node or the aggregated status across all nodes?
Metrics data is reported per-node (each Data Plane) per-subsystem (HTTP or TCP).